So you’re swimming in countless plots of your data over some changing parameter. Sure they’re nice to look at, but are they animated? Didn’t think so.
Here’s how to create an animated .gif image of those Python plots using Photoshop.
Step 1: Generate the plots
I’ve found that a few lines of Python to programmatically draw and save your plots to a folder eliminates a lot of editing and tweaking later on.
For this tutorial, I’ll use my synthetic photometry code to generate color-parameter plots across surface gravities of 3.0dex to 6.0dex.
First I created a folder on my desktop to dump the plots called RI_teff.
Then in the Python interpreter it looks like:
In [1]: grav = [round(i*0.1,1) for i in range(30,61)]

In [2]: import syn_phot as s

In [3]: for i in g:

s.color_param('R','I',logg=i,save='/Desktop/RI_teff/')
Now I can create the animated .gif in Photoshop.
Step 2: Pull plots into Photoshop as layers
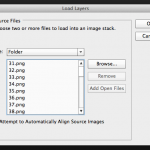
 Open Photoshop and click File > Scripts > Load Files into Stack…
Select the folder on your Desktop that has all the plots and click ok.
Photoshop will open each image as a layer in a new project window.
Step 3: Create frames from each layer
Next click Window > Timeline to show the Timeline across the bottom of the program.
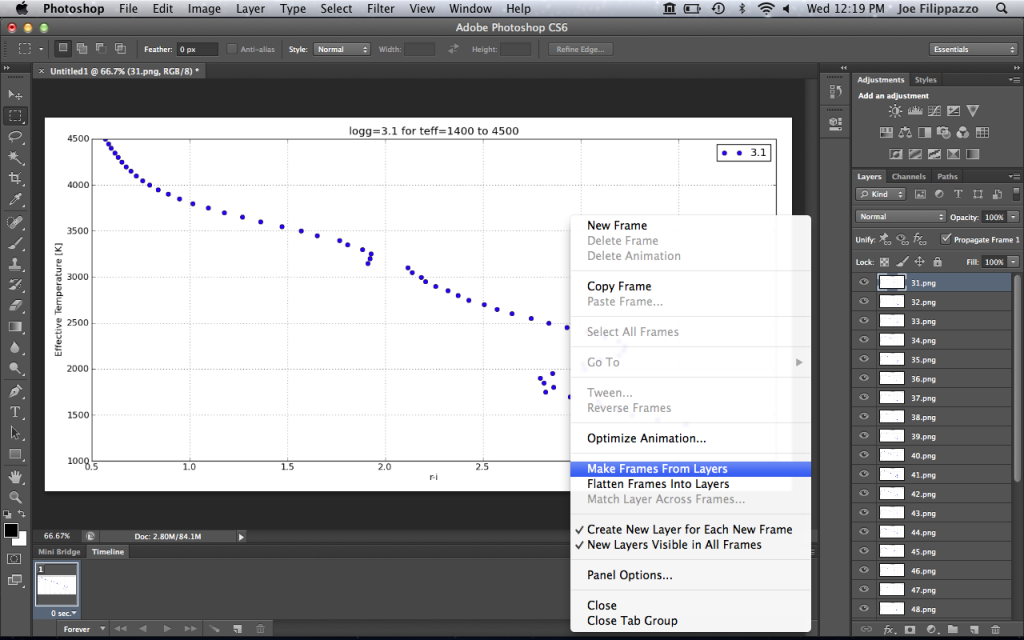
In the top-right corner of your Timeline, you’ll see a little button that has all the Timeline options. Click it and select Make Frames From Layers. Here’s what it looks like:
This will populate your Timeline with one frame for each image layer.
Click the Timeline options button again and click Reverse Frames if necessary. Otherwise, you can drag and drop the frames into the desired order.
Step 4: Timing is everything
 Next we need to set the timing of each frame. Select the first frame from the Timeline then hold down the Shift button and select the last frame to select them all.
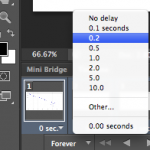
Next click on any frame where it says 0 sec. with a down arrow. Then select the display time for each frame in the animation.
I typically set the frames to be 0.2 or 0.5 seconds each, depending on the number of total frames. Then I set the last frame to be 2 seconds so it’s as if the image pauses when it finishes before starting the animation over.
Step 5: Save it!
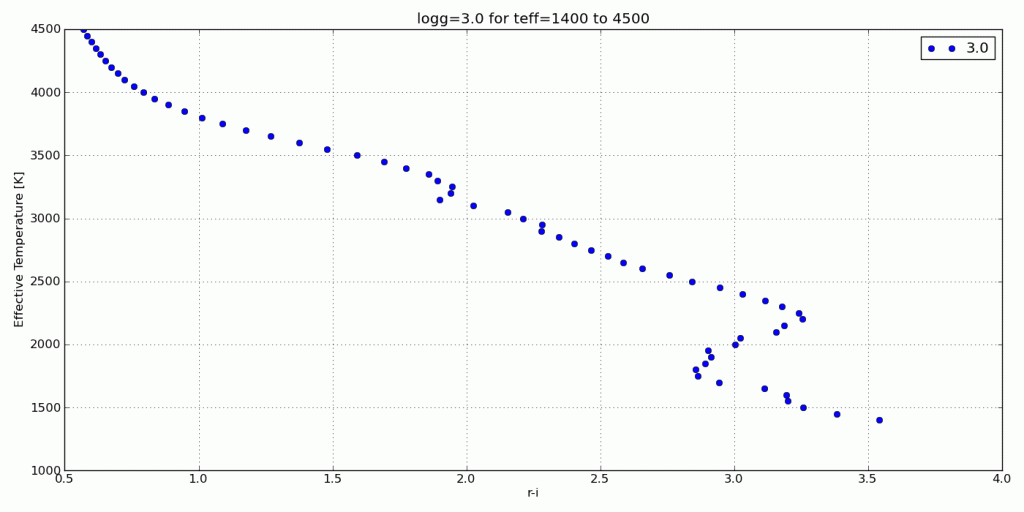
Finally, click File > Save for Web… and make sure you have GIF filetype selected. Click Save and you’re done! Here’s the result:


You can also make an animation (.mov file) from image files in Quicktime Pro, which is rather more affordable than Photoshop.
For things like this there’s also the command-line tool gifsicle (click on my name for the link).
The caveats:
1.) All the input images must be in .gif format, not .png or .jpg
2.) You cannot easily reverse the order of the images. They’ll go in alphabetically sorted order, or you have to list them one by one.
3.) It’s a command line program, and therefore not always the easiest to use.
Still:
gifsicle –delay=20 –loop *.gif > anim.gif
gifsicle -b anim.gif –delay=200 “#100”
will create a looping animated .gif with .2 second delay between all frames but frame 100, which is displayed for 2 seconds.
If you make LOTS of animated .gifs and know exactly what you want, gifsicle might be faster.
Pingback: Brown Dwarf Synthetic Photometry | BDNYC
It seems a bit over the top to use Photoshop to create an animated gif from a series of png frames. Check the ImageMagick solution here: http://glowingpython.blogspot.com/2011/09/eigenvectors-animated-gif.html
Basically, it’s a one-liner on the command line once you’ve gotten your frames ready.
Also, take a look at this topic at StackOverflow:
http://stackoverflow.com/questions/753190/programmatically-generate-video-or-animated-gif-in-python