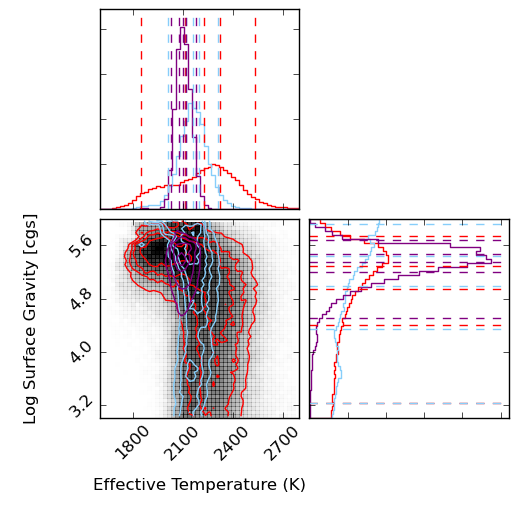
In my first serious foray into Python and github I adapted some plotting code from Dan Foreman_Mackey with the help of Adrian Price-Whelan and Joe Filippazzo to create contour plots and histograms of my fitting results! These are histograms MCMC results for model fits to a low-resolution near-infrared spectrum of a young L5 brown dwarf, in temperature and gravity atmospheric parameters. The colors represent different segments of the spectrum – purple is YJH, blue is YJ, red is H. The take-away is that different segments of the spectrum results in different temperatures, and all parts of the spectrum make it look old (high gravity). This is probably because the overly-simplistic dust treatments in the models are not sufficient for young, low-mass objects.
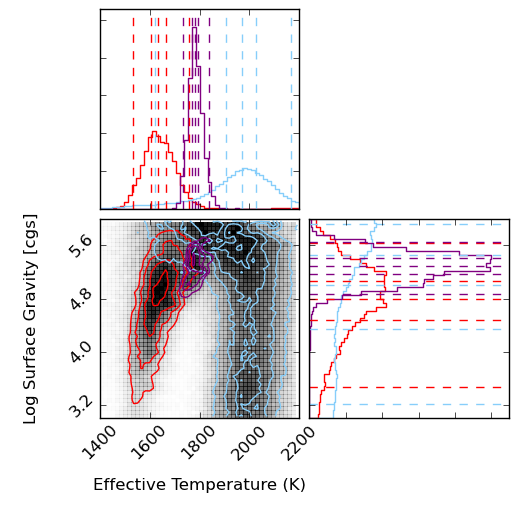
The baseline for comparison is the result for a field L5 dwarf, shown below. The temperatures are much more consistent with one another and what you would expect for an L5 spectral type from other methods, and the gravities are similarly high (although too high for comfort for J band). This is reassuring for the method in general and probably means that we need most sophisticated dust treatments in the models to handle giant-exoplanet-like young brown dwarfs. Paper will be submitted soon!