BDNYC Summer 2016

Summer is always a special time for BDNYC because it’s when we have the most time to dedicate to research and spending time with each other! This summer, the group has students from Hunter College, the College of Staten Island, the Graduate Center, Columbia, and Barnard. I’m also proud to say that the SDSS Faculty and Student Teams (FAST) initiative is now supporting our students in addition to AstroComNYC and our NASA and NSF grants. Things are busy, but we took a second at the end of group meeting yesterday to take a picture:

Group Photo Summer 2016

BDNYC at CUWiP 2016

The Conference for Undergraduate Women in Physics, or CUWiP, is a set of simultaneous conferences taking place across the United States and supported by the American Physical Society. A variety of activities take place in the conferences including plenary talks, panel discussions, student posters and talks, workshops, and graduate school and career fairs.

This year, BDNYC members Victoria DiTomasso, Haley Fica, and Ellie Schwab attended CUWiP. Victoria and Ellie attended the conference held at Wesleyan University, while Haley attended the one held at Georgia Institute of Technology. All three presented posters on the research they carry out with BDNYC. You can find copies of the posters below.

Continue reading

A New Focus for the BDNYC Blog

With this coming year, we are aiming to refocus the content in this blog. While this blog does include general purpose information about brown dwarf research, most of the content was geared towards internal descriptions of our software, our database, and our setup that are relevant only for members of BDNYC. We’re now using Trac to manage the internal workings of our team and will be changing some of the content you see on these pages.

From now on, you’ll see posts describing general tips and tricks, including coding, project management techniques (such as using Trac), and observing tricks. You’ll also see posts announcing team publications as well as team presence at conferences such as AAS. Finally, we hope to publish posts describing the small, incremental steps we take as we carry out our research, which include interesting results and plots.

We hope these changes will result in more frequent posts and will make the blog more valuable to the community as a whole.

Rotational and Vibrational Energy of Diatomic Molecules

Molecules can store energy in 4 different ways: translation (whole molecule moves in each of 3 Cartesian coordinates), rotation (whole molecule rotates—linear molecules can rotate around 2 axes, nonlinear around all 3 axes), vibration (bonds stretch and contract—3N-5 kinds of vibrations for linear molecules, 3N-6 for nonlinear), and electronic (ground state vs. excited). The energy absorbed in electronic transitions is usually in the UV-visible range, that for vibrations is in the IR range, for rotations in the microwave range, and the transition energy for translations is basically infinitesimal. This is because electronic transitions require the most energy, then vibrations, rotations and finally translations require the least. With high enough resolution, rotational transitions can be seen in vibrational spectra, with the rotational transitions giving structure to the vibrational absorption peaks.

Figure 1: An energy diagram showing the relative energies for rotational, vibrational, and electronic transitions and how they overlap.3

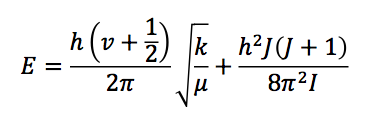
The energy of rotational and vibrational levels can be calculated separately and summed. Vibrations can be modeled using the simple harmonic oscillator—the potential energy of which comes from Hooke’s law. Rotational energy of a molecule can be calculated by assuming the molecule acts as a rigid rotor and solving the corresponding Schrodinger Equation. Both of these types of energy are quantized, which accounts for the vibrational (v) and rotational (J) quantum levels in the equation.

This equation will give energy levels in Joules. Vibrational spectroscopists generally use units of wavenumbers, or cm-1, though, which can be found by dividing the entire equation by hc.

where

and

  • v: vibration quantum number (0,1,2,…)
  • J: rotation quantum number (0,1,2,…)
  • k: spring constant/strength of bond
  • μ: reduced mass
  • I: moment of inertia, where is bond length
  • B: rotational constant

I began looking into this to explain why multiple carbon monoxide absorption peaks appeared where they did in my near-IR spectra at 2.29 and 2.32 microns or 4367 and 4310 cm-1. I was able to calculate the correct 2.29 μm peak by subtracting the energy where v=0 and J=8 from the energy where v=2 and J=10. This means that these peaks are due to the first vibrational overtone of CO, i.e. Δv=2 instead of 1. The peak at 2.32 and any other peaks around the same area can be found by going from different rotational energy states, 6 to 8, 4 to 6, etc. ΔJ for CO is usually ±2 because it is a linear molecule.

  1. McQuarrie, Donald A. Quantum Chemistry. 2nd ed. Sausalito: University Science Books, 2008.
  2. Atkins, P.; de Paula, J. Physical Chemistry. 8th ed. New York: W. H. Freeman and Company, 2006.
  3. “Electronic Spectra of Organic Molecules”. Organic Chemistry. http://www.organicchemistry.com/electronic-spectra-in-raman-spectroscopy/. Accessed July 24, 2014.

On solving the Rigid Rotor Schrodinger Equation:

http://chemwiki.ucdavis.edu/Physical_Chemistry/Quantum_Mechanics/Quantum_States_of_Atoms_and_Molecules/7._Rotational_States/Solving_the_Rigid_Rotor_Schrödinger_Equation

Special thanks to Professor Andrew Crowther.


Identifying Nearby Young Stars, Part 2: The Convergence Point

The one sure thing about a moving group is that all the stars are supposed to be moving together through space.
Even without full 3D kinematics, we can still see this: The Pleiades cluster and Hyades cluster members all have similar proper motion position angles: 160 for the Pleiades, 110 for the Hyades (both in the system where due North is 0, and due East is 90). In fact, the Ursa Major moving group (composed of most of the stars in the Big Dipper) was initially found this way.

That only works well with clusters, though. If you have a moving group or young association that’s spread out over large regions of sky, the directions the members are moving in will change:

Young star proper motions

A plot of the proper motion vectors (scaled up 180,000 times) of young stars in Zuckerman & Song (2004) and Torres et al. (2008) color-coded by association (see Part 1, or later on in this post for the key). The + sign is the Solar Point (the Sun is basically moving toward that point), and the X is the Anti-Solar point, which the Sun is moving away from.

There’s still a pattern here, though; compare it to a plot of the basically random positions of ALL 2130 star systems within 25 pc (81.3 ly) of the Sun:

Nearby star Proper Motions

Same as above, now with all star systems within 25 parsecs (81.3 light years). In general, motions are random and faster. There are some young stars within 25 pc, these are still color-coded.

Still, while the proper motions of stars in associations may differ, they WILL, however, converge at a particular point on the sky called (appropriately) the ‘Convergent Point’. The convergent point is exactly analogous to the vanishing point we’re familiar with when we see a road or a train track vanishing off into the distance. Here, however, instead of parallel rails, we have a collection of stars moving along parallel paths. All the stars seem to be COMING from one point, and GOING TO another point.

To see the convergent point, I extend the proper motion vectors of the nearby young stars mentioned in Zuckerman & Song (2004) and Torres et al. (2008) into great circles (lines of circumference around a sphere). The result is shown below:
Great Circles for all young stars
I can break this down, though, into a series of group-by-group plots:
Convergence Points for Associations
Some observations:

  • The fact that all the young association convergence points are near the Anti-Solar Point (the X; examine the shorter vector plot to see which direction they’re heading) implies that it’s really the Sun doing most of the moving; the associations are “disappearing behind us” as we pass them. The associations do have some small differences in velocity relative to each other, and that accounts for their convergence points being slightly offset from the Anti-Solar Point.
  • It’s no accident that 2MASS J06085283-2753583 (Rice et al. 2010) and 2MASS J06131330-2742054 (Malo et al. 2013) have extremely low proper motions; they are sitting almost on top of the Beta Pic convergence point, so their motions should be entirely in the line of sight, and pointed away from us.
  • Some of the stars in Tuc-Hor (and others, too) do NOT converge with the rest of them; they may not actually be members.  Or my proper motion is wrong.
  • I have no proper motions for some stars in Beta Pic and TW Hya, hence no great circles for them.
  • The Octans association itself does not really converge. I would not be the first person to suggest that Octans is not a real association.

How to embed a live Google Docs spreadsheet into a webpage

Let’s say you have a set of data in an Excel document or Google spreadsheet* and you want to share it with the public by posting it on your webpage. You no longer have to create a static HTML table; in fact, Google allows for embedding a table on a webpage that is updated as the original Google Doc is updated. The way to do it is by creating what is called a “live” spreadsheet.

The process is very simple and the results will definitely save you a lot of time.

  • First, import your Excel file in Google Docs or open your Google spreadsheet;
  • File > Publish to the Web…;
  • Check the box that says “Automatically republish when changes are made”;
  • Click “Start Publishing”;
  • Change “Get a link to the published data” from “Web page” to “HTML to embed in a page”;
  • Copy and paste the HTML code generated (should start in “<iframe”) in an HTML-enabled space on your webpage.

At this point, you would just need to make changes on your Google spreadsheet to see the table on your website edited as well. In my testing, the automatic update always worked flawlessly; however, if that does not happen:

  • Open your Google Doc;
  • File > Publish to the Web… > Republish now.
  • Magic! You should see the table data updated on your website.
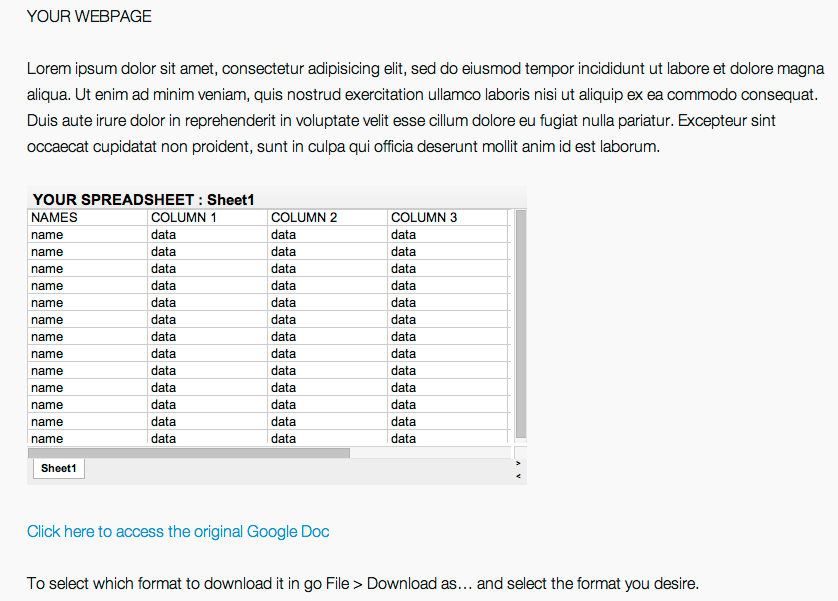
This is how the embedded spreadsheet will appear on your webpage.

You can now adjust width, height and frameborder by changing the values in the <iframe> code in HTML mode.

Linking to the original Google Doc

Now, what if you also want users to be able to access your original table?

The way to do this is also very easy and I found it here (theBioBucket).

In your webpage, in HTML mode, write a code using the standard HTML notation to create a link <a href=”URL”> YOUR TEXT HERE </a>
The URL you will have to plug in is your Google doc one, found under “Share…”:
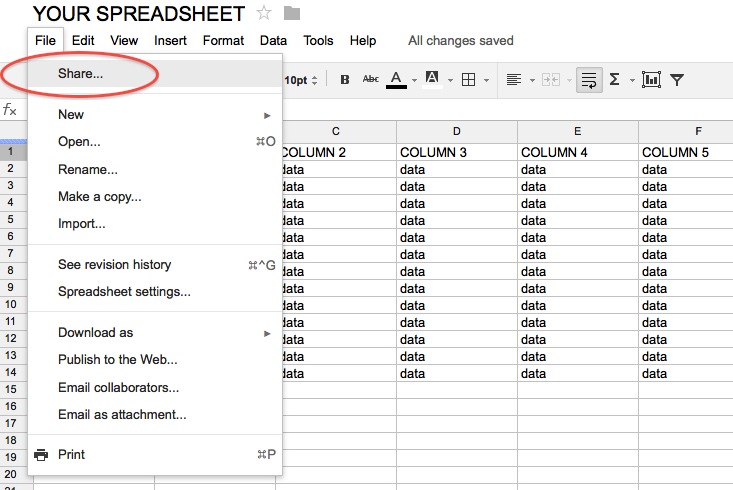
Click “Share…” under “File”

Grab the URL circled and paste it in the HTML code.

Once you’ve done that, you can simply write something like “Click here to access the Google document for this table” in the YOUR TEXT HERE space, and… all done!

A Google account is not necessary to view the original Google Doc. Any user on the web can access the original Google spreadsheet in view-only mode. They won’t be allowed to alter the original table in any way, but they will have access to a spreadsheet downloadable in different formats  (e.g. .pdf, .csv, .txt). To download, simply click File > Download as… and save the document on your computer in all the formats available in Google Docs.

* Note: This method works with every format available in Google Docs but this post focuses on spreadsheets.