Photon Flux Density vs. Energy Flux Density

One of the subtleties of photometry is the difference between magnitudes and colors calculated using energy flux densities (EFD) and photon flux densities (PFD).

The complication arises since the photometry presented by many surveys is calculated using PFD but spectra (specifically the synthetic variety) is given as EFD. The difference is small but measurable so let’s do it right.

The following is the process I used to remedy the situation by switching my models to PFD so they could be directly compared to the photometry from the surveys. Thanks to Mike Cushing for the guidance.

Filter Zero Points

Before we can calculate the magnitudes, we need filter zero points calculated from PFD. To do this, I started with a spectrum of Vega in units of [erg s-1 cm-2 A-1] snatched from STSci.

Then the zero point flux density in [photons s-1 cm-2 A-1] is:

$$!F_{zp}=\frac{\int p_V(\lambda) S(\lambda) d\lambda}{\int S(\lambda)d\lambda}=\frac{\int e_V(\lambda)\left( \frac{\lambda}{hc}\right) S(\lambda) d\lambda}{\int S(\lambda)d\lambda}$$

Where $$e_V$$ is the given energy flux density in [erg s-1 cm-2 A-1] of Vega, $$p_V$$ is the photon flux density in [photons s-1 cm-2 A-1], and $$S(\lambda)$$ is the scalar filter throughput.

Since I’m starting with a spectrum of Vega in EFD units, I need to multiply by $$\frac{\lambda}{hc}$$ to convert it to PFD units.

In Python, this looks like:

def zp_flux(band):
    from scipy import trapz, interp, log10
    (wave, flux), filt, h, c = vega(), get_filters()[band], 6.6260755E-27 # [erg*s], 2.998E14 # [um/s]
    I = interp(wave, filt['wav'], filt['rsr'], left=0, right=0)
    return trapz(I*flux*wave/(h*c), x=wave)/trapz(I, x=wave))

Calculating Magnitudes

Now that we have the filter zero points, we can calculate the magnitudes using:

$$!m = -2.5\log\left(\frac{F_\lambda}{F_{zp}}\right)$$

Where $$m$$ is the apparent magnitude and $$F_\lambda$$ is the flux from our source given similarly by:

$$!F_{\lambda}=\frac{\int p_\lambda(\lambda) S(\lambda) d\lambda}{\int S(\lambda)d\lambda}=\frac{\int e_\lambda(\lambda)\left( \frac{\lambda}{hc}\right) S(\lambda) d\lambda}{\int S(\lambda)d\lambda}$$

Since the synthetic spectra I’m using are given in EFD units, I need to multiply by $$\frac{\lambda}{hc}$$ to convert it to PFD units just as I did with my spectrum of Vega.

In Python the magnitudes are obtained the same way as above but we use the source spectrum in [erg s-1 cm-2 A-1] instead of Vega. Then the magnitude is just:

mag = -2.5*log10(source_flux(band)/zp_flux(band))

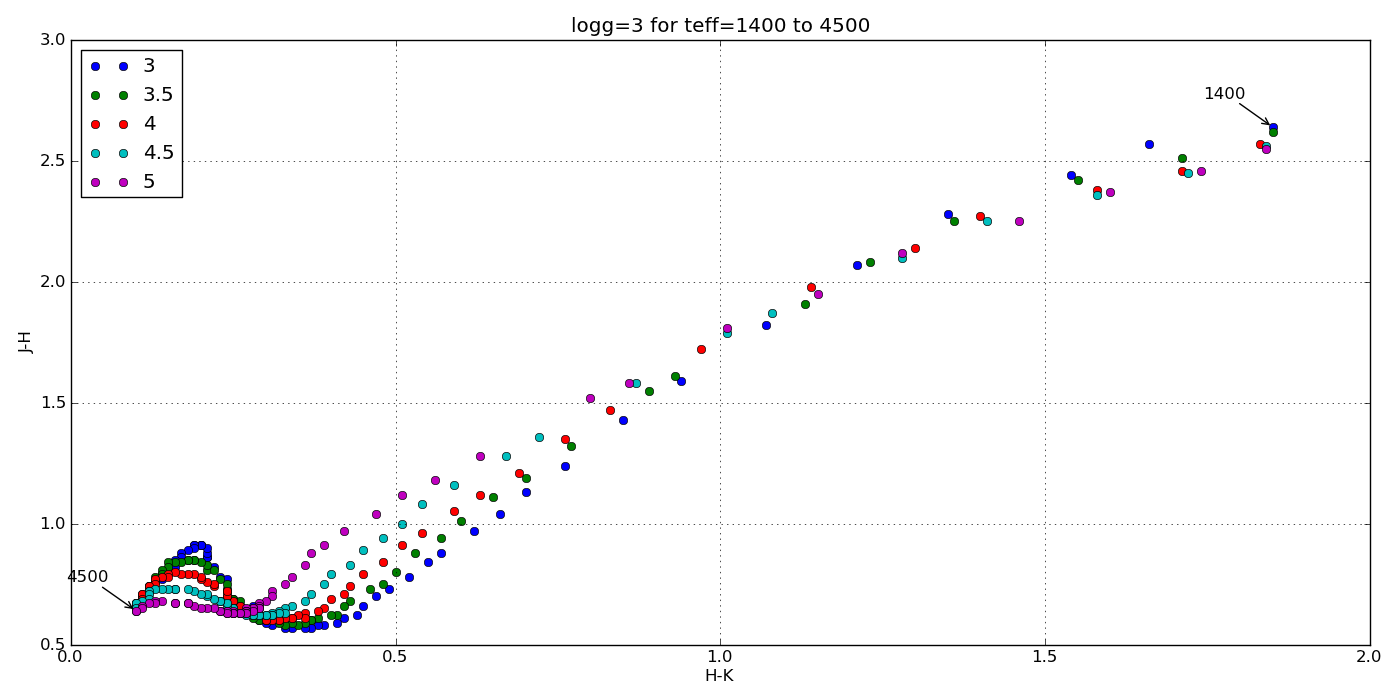
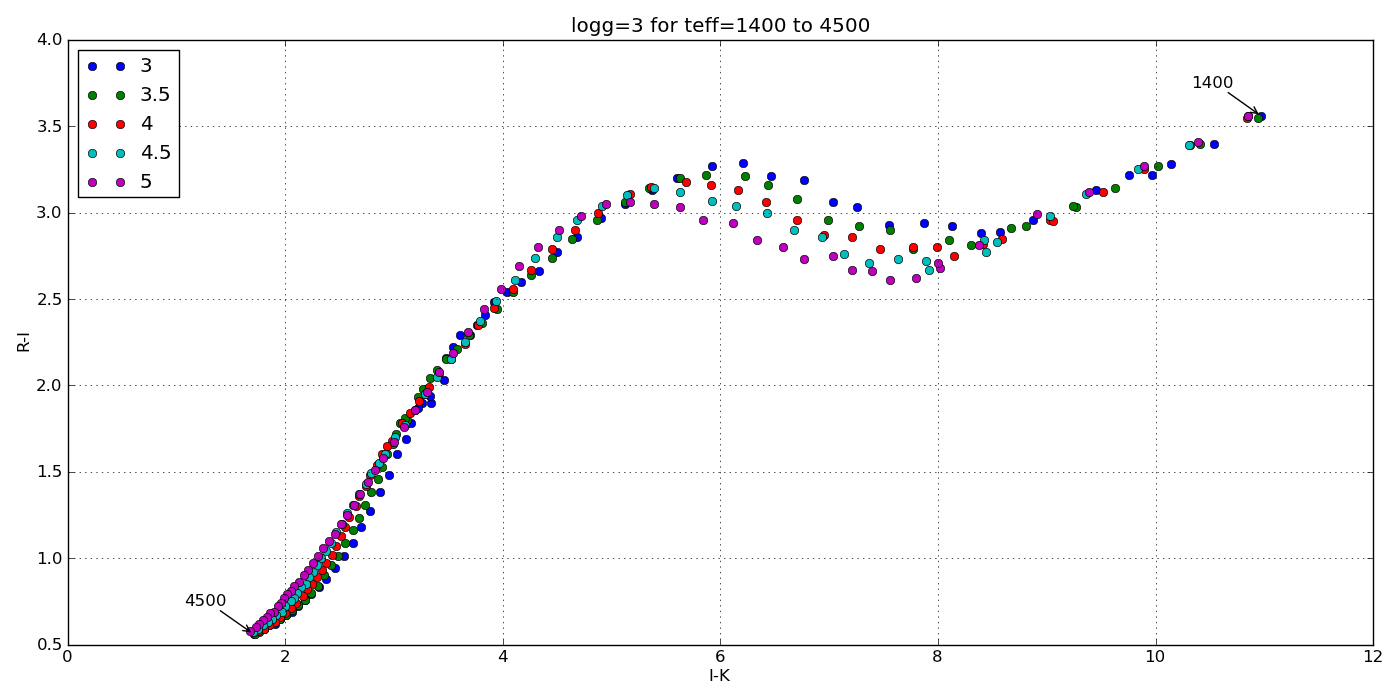
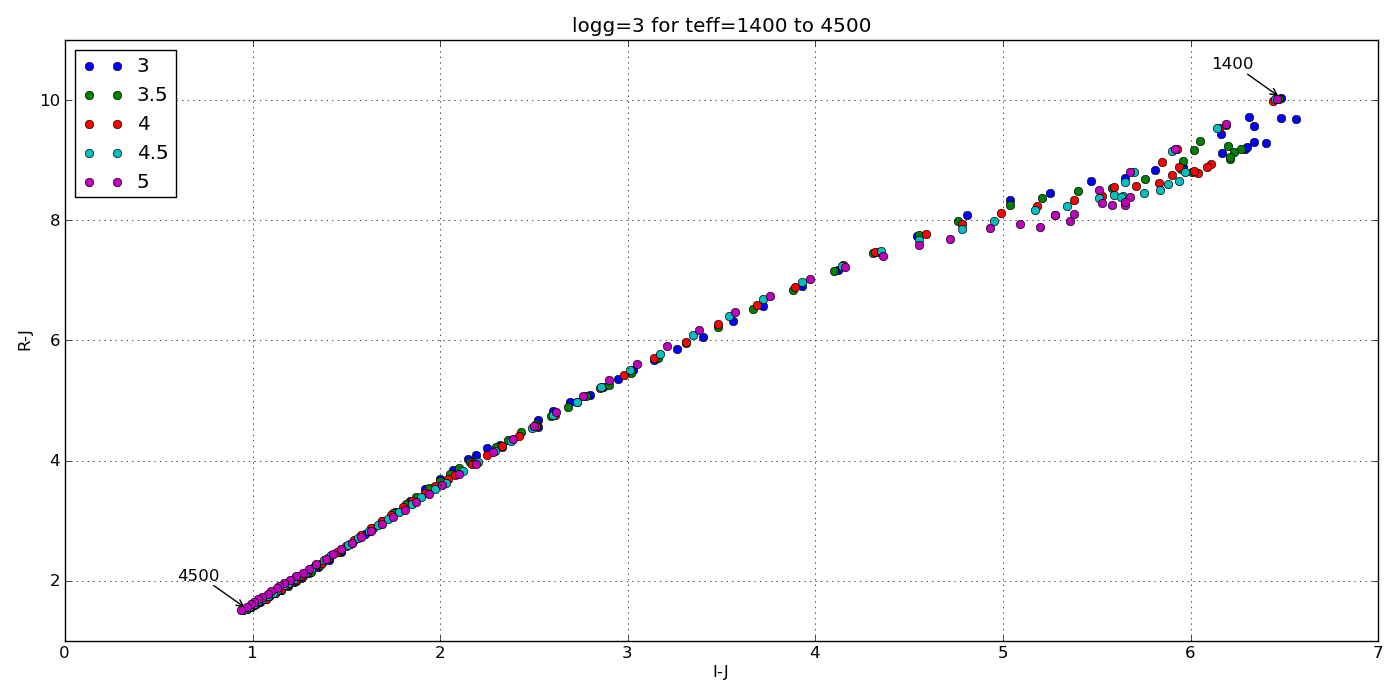
Below is an image that shows the discrepancy between using EFD and PFD to calculate colors for comparison with survey photometry.

The circles are colors calculated from synthetic spectra of low surface gravity (large circles) to high surface gravity (small circles). The grey lines are iso-temperature contours. The jumping shows the different results using PFD and EFD. The stationary blue stars, green squares and red triangles are catalog photometric points calculated from PFD.

The circles are colors calculated from synthetic spectra of low surface gravity (large circles) to high surface gravity (small circles). The grey lines are iso-temperature contours. The jumping shows the different results using PFD and EFD. The stationary blue stars, green squares and red triangles are catalog photometric points calculated from PFD.

Other Considerations

The discrepancy I get between the same color calculated from PFD and EFD though is as much as 0.244 mags (in r-W3 at 1050K), which seems excessive. The magnitude calculation reduces to:

$$!m = -2.5\log\left( \frac{\int e_\lambda(\lambda)S(\lambda) \lambda d\lambda}{\int e_V(\lambda) S(\lambda) \lambda d\lambda}\right)$$

Since the filter profile is interpolated with the spectrum before integration, I thought the discrepancy must be due only to the difference in resolution between the synthetic and Vega spectra. In other words, I have to make sure the wavelength arrays for Vega and the source are identical so the trapezoidal sums have the same width bins.

This reduces the discrepancy in r-W3 at 1050K from -0.244 mags to -0.067 mags, which is better. However, the discrepancy in H-[3.6] goes from 0.071 mags to -0.078 mags.

To Recapitulate

In summary, I had a spectrum of Vega and some synthetic spectra all in energy flux density units of [erg s-1 cm-2 A-1] and some photometric points from the survey catalogs calculated from photon flux density units of [photons s-1 cm-2 A-1].

In order to compare apples to apples, I first converted my spectra to PFD by multiplying by $$\frac{\lambda}{hc}$$ at each wavelength point before integrating to calculate my zero points and magnitudes.

Brown Dwarf Synthetic Photometry

The goal here was to get the synthetic colors in the SDSS, 2MASS and WISE filters of ~2000 model objects generated by the PHOENIX stellar and planetary atmosphere software.

Since it would be silly (and incredibly slow… and much more boring) to just calculate and store every single color for all 12 filter profiles, I wrote a module to calculate colors a la carte.

The Filters

I got the J, H, and K band relative spectral response (RSR) curves in the 2MASS documentation, the u, g, r, i and z bands from the SDSS documentation, and the W1, W2, W3, and W4 bands from the WISE documentation.

I dumped all my .txt filter files into one directory and wrote a function to grab them all, pull out the wavelength and transmission values, and output the filter name in position [0], x-values in [1], and y-values in [2]:

def get_filters(filter_directory):
  import glob, os
  files = glob.glob(filter_directory+'*.txt')
 
  if len(files) == 0:
    print 'No filters in', filter_directory
  else:
    filter_names = [os.path.splitext(os.path.basename(i))[0] for i in files]
    RSR = [open(i) for i in files]
    filt_data = [filter(None,[map(float,i.split()) for i in j if not i.startswith('#')]) for j in RSR]
    for i in RSR: i.close()
 
    RSR_x = [[x[0] for x in i] for i in filt_data]
    RSR_y = [[y[1] for y in i] for i in filt_data]
    filters = {}
    for i,j,k in zip(filter_names,RSR_x,RSR_y):
      filters[i] = j, k, center(i)
 
    return filters

Calculating Apparent Magnitudes

We can’t have colors without magnitudes so here’s a function to grab the Teff and log g specified spectra, and calculate the apparent magnitudes in a particular band:

def mags(band, teff='', logg='', bin=1):
  from scipy.io.idl import readsav
  from collections import Counter
  from scipy import trapz, log10, interp
  
  s = readsav(path+'modelspeclowresdustywise.save')
  Fr, Wr = [i for i in s.modelspec['fsyn']], [i for i in s['wsyn']]
  Tr, Gr = [int(i) for i in s.modelspec['teff']], [round(i,1) for i in s.modelspec['logg']]
  
  # The band to compute
  RSR_x, RSR_y, lambda_eff = get_filters(path)[band]
  
  # Option to specify an effective temperature value
  if teff:
    t = [i for i, x in enumerate(s.modelspec['teff']) if x == teff]
    if len(t) == 0:
      print "No such effective temperature! Please choose from 1400K to 4500K in 50K increments or leave blank to select all."
  else:
    t = range(len(s.modelspec['teff']))
  
  # Option to specify a surfave gravity value
  if logg:
    g = [i for i, x in enumerate(s.modelspec['logg']) if x == logg]
    if len(g) == 0:
      print "No such surface gravity! Please choose from 3.0 to 6.0 in 0.1 increments or leave blank to select all."
  else:
    g = range(len(s.modelspec['logg']))
  
  # Pulls out objects that fit criteria above
  obj = list((Counter(t) & Counter(g)).elements())
  F = [Fr[i][::bin] for i in obj]
  T = [Tr[i] for i in obj]
  G = [Gr[i] for i in obj]
  W = Wr[::bin]
  
  # Interpolate to find new filter y-values
  I = interp(W,RSR_x,RSR_y,left=0,right=0)
  
  # Convolve the interpolated flux with each filter (FxR = RxF)
  FxR = [convolution(i,I) for i in F]
  
  # Integral of RSR curve over all lambda
  R0 = trapz(I,x=W)
  
  # Integrate to find the spectral flux density per unit wavelength [ergs][s-1][cm-2] then divide by R0 to get [erg][s-1][cm-2][cm-1]
  F_lambda = [trapz(y,x=W)/R0 for y in FxR]
  
  # Calculate apparent magnitude of each spectrum in each filter band
  Mags = [round(-2.5*log10(m/F_lambda_0(band)),3) for m in F_lambda]
  
  result = sorted(zip(Mags, T, G, F, I, FxR), key=itemgetter(1,2))
  result.insert(0,W)
  
  return result

Calculating Colors

Now we can calculate the colors. Next, I wrote a function to accept any two bands with options to specify a surface gravity and/or effective temperature as well as a bin size to cut down on computation. Here’s the code:

def colors(first, second, teff='', logg='', bin=1):
  (Mags_a, T, G) = [[i[j] for i in get_mags(first, teff=teff, logg=logg, bin=bin)[1:]] for j in range(3)]
  Mags_b = [i[0] for i in get_mags(second, teff=teff, logg=logg, bin=bin)[1:]]
  colors = [round(a-b,3) for a,b in zip(Mags_a,Mags_b)]
  
  print_mags(first, colors, T, G, second=second)
  
  return [colors, T, G]

The PHOENIX code gives the flux as Fλ in cgs units [erg][s-1][cm-2][cm-1] but as long as both spectra are in the same units the colors will be the same.

Makin’ It Handsome

Then I wrote a short function to print out the magnitudes or colors in the Terminal:

def print_mags(first, Mags, T, G, second=''):
  LAYOUT = "{!s:10} {!s:10} {!s:25}"
  
  if second:
    print LAYOUT.format("Teff", "log g", first+'-'+second)
  else:
    print LAYOUT.format("Teff", "log g", first)
  
  for i,j,k in sorted(zip(T, G, Mags)):
    print LAYOUT.format(i, j, k)

The Output

Then if I just want the J-K color for objects with log g = 4.0 over the entire range of effective temperatures, I launch ipython and just do:

In [1]: import syn_phot as s
In [2]: s.colors('J','K', logg=4)
Teff -------- log g -------- J-K
1400.0 ------ 4.0 ---------- 4.386
1450.0 ------ 4.0 ---------- 4.154
...
4450.0 ------ 4.0 ---------- 0.756
4500.0 ------ 4.0 ---------- 0.733

Similarly, I can specify just the target effective temperature and get the whole range of surface gravities. Or I can specify an effective temperature AND a specific gravity to get the color of just that one object with:

In [3]: s.colors('i','W2', teff=3050, logg=5)
Teff -------- log g -------- J-K
3050.0 ------ 5.0 ---------- 3.442

I can also reduce the number of data points in each flux array if my sample is very large. I just have to specify the number of data points to skip with the “bin” optional parameter. For example:

In [4]: s.colors('W1','W2', teff=1850, bin=3)

This will calculate the W1-W2 color for all the objects with Teff = 1850K and all gravities, but only take every third flux value.

I also wrote functions to generate color-color, color-parameter and color-magnitude plots but those will be in a different post.

Plots!

Here are a few color-parameter animated plots I made using my code. Here’s how I made them. Click to animate!

And here are a few colorful-colorful color-color plots I made:

Plots with observational data

Just to be sure I’m on base, here’s a color-color plot of J-H vs. H-Ks for objects with a log surface gravity of 5 dex (blue dots) plotted over some data for the Chamaeleon I Molecular Cloud (semi-transparent) from Carpenter et al. (2002).

The color scale is for main sequence stars and the black dots are probable members of the group. Cooler dwarfs move up and to the right.

And here’s a plot of J-Ks vs. z-Ks as well as J-Ks vs. z-J. Again, the blue dots are from my synthetic photometry code at log(g)=5 and the semi-transparent points with errors are from Dahn et al. (2002).